Methane, Microorganisms, and Mine
pollution:
The possible recovery and carbon cost in lake
sediments after the Mount Polley Mine disaster
Supplementary Materials
Angus Ball
The University of Northern British Columbia
MSc Natural Resources and Environmental Studies
Dr. Michael Preston
05/2025
Abstract
A
large fraction of all lakes on the earth is represented by the high latitude
lakes, contributing up to 18.8 Tg methane emission
(twice the emission from the oceans) into the atmosphere per year that has
critical implications for global climate. Anaerobic oxidation of methane (AOM)
is a major biogeochemical process that plays a pivotal role in mitigating
methane emissions to the atmosphere in the absence of oxygen in various
ecosystems. The high latitudes (boreal/sub-boreal zones) are where an estimated
80% of the mining in Canada occurs. The impacts of mine drainage generated from
mining of massive sulfide ore bodies (mine effluent) on the quality and
geochemistry of waters and sediments characterized by high concentrations of Fe2+,
SO42-, heavy metals and other constituents have been well
documented for lakes and pit lakes. Despite these lake sediments being one of
the largest global sinks for methane (as a very potent greenhouse gas),
anaerobic oxidation of methane and the impacts of mining activities on this
important biogeochemical process (particularly AOM linked to iron) is still
very poorly understood both in terms of geochemistry and characterization of
the organisms and consortia involved. Notably, Canadian lakes are critically
understudied, with CH₄ emissions measured from only six lakes to date.
Mesocosm experiments were set up with sediments collected from mining impacted
lakes and pristine lakes (as controls) located in BC. We are using a holistic
system biology approach combining tools in genomics, geochemistry, and
environmental microbiology to assess microbial communities and metabolic traits
involved in AOM within the context of mining-impacted environments and the consequences
for methane emission in high-latitude regions. In this poster, we will outline
our experimental design and approach and discuss the implications of such
knowledge for improvement of global biogeochemical and climate projection
models.
Table
of Contents
2.3.2 Bioavailable Metal analysis
2.3.3 Carbon and Sulfur measurements
2.8 Methane flux and rate modeling introduction
2.8.1 Methane flux and
modeling methods
3 Additional Results/Discussion
4.2 Supplementary
materials citations
1 Introduction
Methane (CH4) is an important
greenhouse gas with a global warming potential 28 times greater than carbon
dioxide over a 100-year period (Jackson et al., 2021; Mao et al., 2022; Saunois et
al., 2020).
Methane is released from a variety of ecosystems but freshwater lakes
are the largest natural methane source and contribute 9-27% of global methane
emissions (DAmbrosio and Harrison, 2022;
Jackson et al., 2021). However, Canadian lakes are
critically understudied with CH4 emissions being measured from only
6 lakes (Byrne et al., 2018; Mandryk et al., 2021). Methane is
biologically generated from anaerobic methanogenic archaea who degrade organic
compounds within lake sediment depleted in oxygen and electron acceptors (Van
Grinsven et al., 2022). Living
sympatrically with methanogens are aerobic methanotrophic bacteria and
anaerobic methanotrophic archaea and bacteria, who degrade methane using a
variety of metabolic processes (Chadwick et al., 2022; Van Grinsven et al., 2022). Of particular
interest is the metabolic process of the anaerobic oxidation of methane (AOM) which
is only performed by anaerobic methanotrophic archaea (Chadwick
et al., 2022; Van Grinsven et al., 2022). This process
plays a pivotal role in mitigating methane emissions to the atmosphere in
various ecosystems (Chadwick
et al., 2022; Van Grinsven et al., 2022). While AOM is
well documented in marine systems where sulfate (SO4) plays a primary
role as an electron acceptor, it is unclear how AOM proceeds in freshwater
ecosystems where ammonium (NH4), nitrite (NO2), nitrate
(NO3), SO4, iron (Fe), manganese (Mn), and heavy metals
species are all used as possible electron acceptors through different mechanisms
and consortiums of organisms (Zhao
and Lu, 2023).
Furthermore,
the Anthropocene has degraded many ecosystems and lake sediments are no
exception (Walton
et al., 2023). Often situated close to freshwater
ecosystems, Canada has an approximate 2,100 km2 of land used by
mining operations (Maus et al., 2020). Mine drainage
can alter the quality and geochemistry of lake water and sediments through
increases in Fe, SO4, and heavy metals (Maus
et al., 2020). Therefore, this work proposes to
study Quesnel Lake, a mine impacted lake in Canada. Quesnel Lake, located in
central British Columbia, Canada, is the deepest fjord lake in the world (Byrne
et al., 2018). Quesnel Lake is a large well
studied lake, and is severely impacted after the Mount Polley mine disaster,
the largest mining disaster in Canadian history (Baker
and Thygesen, 2017; Byrne et al., 2018). In 2014, a
tailings dam failure released approximately 18.6 Mm3 of tailings and
supernatant water into the West basin of Quesnel Lake (Owens et al., 2023). These tailings
settled in layers up to 1-5 meters thick on the lakebed, disturbing lake
biogeochemical cycles and ecology (Byrne et al., 2018; Granger et al., 2022; Hatam et
al., 2019). This disruption has provoked
continued investigation from the scientific community in areas of lake
geochemistry (Granger
et al., 2022; Petticrew et al., 2015), water quality (Byrne
et al., 2018; Owens et al., 2023), zoology (Pyle
et al., 2022), and microbiology (Hatam
et al., 2019). However, the lake sediment
microbial community was measured shortly post disturbance, only 10 cm deep and
without focus to methane associated organisms (Hatam
et al., 2019). Now that there has been almost a
decade of recovery time since the spill the microbial community needs to be
reassessed to determine how it has responded to the acute disturbance.
Quesnel Lake, thus, unveils some unique
questions, 1) How has methane cycling and emissions changed post disturbance,
2) how did the microbial community respond to tailings sedimentation, 3) can
this disturbance elucidate how AOM functions within Quesnel Lake or possibly
provide evidence for heavy metal AOM mechanisms, and finally 4) how has the
geochemistry of Quesnel Lakes sediments changed post disturbance?
2
Methods
2.1 Site
description
2.1.1 Quesnel
Lake
Quesnel Lake is a freshwater oligotrophic fjord-type lake
situated within British Columbia, Canada (Petticrew
et al., 2015). This lake has a west, north, and
east arm which are narrow (2.7 km mean width), and long (east-west span ~100
km) (Figure 14) (Petticrew
et al., 2015). With a maximum depth of 511 m and
mean depth of 157 m, Quesnel Lake has an estimated volume of ~1 km3
and ~266 km2 surface area (Petticrew
et al., 2015). Quesnel Lake is home to Pacific and
Sockeye (Oncorhynchus spp.) Salmon stocks and many resident fish
populations such as Chars (Salvenlinus spp.) (Petticrew
et al., 2015).
August
4th 2014, a tailings damn failure within the Mount Polley mine
released an estimated 25 Mm3 of material into the surrounding Polley
lake, Hazeltine Creek and Quesnel Lake (Petticrew
et al., 2015). The west basin in the west arm of
Quesnel Lake received ca. 18.6 Mm3 of this material: 12.8 Mm3
of tailings and interstitial water, 4.6 Mm3 of supernatant water
from the tailings storage facility and 1.2 Mm3 of native soil and
eroded overburden from Hazeltine Creek (Owens
et al., 2023). This material settled into a ca.
1-2 km wide, 5-10 m deep area, ~6 km across (Owens
et al., 2023; Petticrew et al., 2015).
In
July 2023, 14 gravity cores and 3 methane measurement cores were collected each
from the north arm (reference site) and west arm (disturbed site) (Figure 1) (Hatam
et al., 2019). All the cores in the west basin
were collected between ca. 60 and 70 meters below the water line. All the cores
in the north arm were collected between ca. 60 and 65 meters below the water
line.
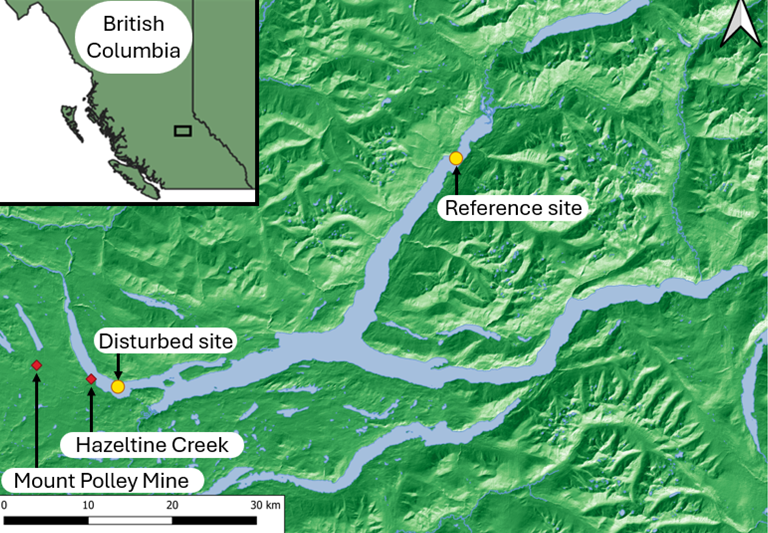
Figure 1. Overview of sampling
locations within Quesnel Lake, British Columbia, Canada. Map created using QGIS
(Creative Commons Attribution-ShareAlike 3.0 license
(CC BY-SA)) using Atlas of Canada base data (Open Government License Canada
Version 2.0).
2.2 Core
collection
2.2.1 Gravity
cores
To collect the gravity
cores and methane measurement cores from Quesnel Lake, a piston type gravity
corer with a core length of 50 cm and core internal diameter of 4.76 cm was
used. Briefly, the gravity corer was lowered into the lake by hand until a
depth of ca. 1 meter above the lake sediment. The corer was then released to fall
into the sediment. A messenger was then released down the line to activate the
piston, which created a suction to hold the sediment in the corer as it was
hand pulled to the surface. At the surface, the core was removed from the
corer, caps were added to the top and bottom of the core. The gravity cores
collected via this method were stored at room temperature for up to 8 hours
until sample collection was complete. The cores were then stored at 4°C until
extrusion. The methane measurement cores were measured immediately after
collection.
2.2.2 Gravity
core extrusion
Gravity cores were
extruded via a pneumatic core extruder at 1 cm intervals. Briefly, using a foot
pedal the sediment was raised 1 cm, then a putty knife removed the sediment
into a collection bag. For 4 cores, extrusion happened under aerobic conditions
with the putty knife and parts of the extruder being disinfected with 10%
bleach and 70% ethanol after each extrusion. For 9 cores, extrusion was
performed anaerobically in a modified field anaerobic glove box designed
specifically for core extrusion. No bleach or ethanol was used during anaerobic
extrusion due to the accumulation of vapours within the glove box may
contaminate the sediment and have systematic effects on incubations performed
during later experiments. Instead, the putty knife was wiped down with paper
towels between each extruded layer to minimize contamination between
extrusions. Of these 9 cores, 5 were frozen at -20°C and 4 were refrigerated at
4°C. The 14th core was left unextruded at 4°C.
2.2.3 Methane
Measurement
Cores taken for methane
measurements had holes predrilled at every centimeter which were plugged by
tape. Immediately after the core was removed from corer, 1.5 ml of
sediment/liquid slurry was extracted from predrilled holes and added to 3.5 ml
of 10% NaOH to stop methane cycling within the sediment. The mixture was
contained in a 10 ml test tube and capped with a butyl rubber stopper. Methane
concentration in headspace was determined by gas chromatography flame ionized
detection (GC-FID).
2.2.4
Sampling regime
Quesnel Lake sites have
triplicate biological replication within each depth tested. Nine depths were
measured throughout the Quesnel Lake sediments. Three anaerobically sectioned
frozen cores were ground aerobically under liquid nitrogen. This material will
be used for all geochemical and microbiological analyzes. Finally, three
anaerobically sectioned refrigerated cores were be used for all incubations.
2.3
Geochemical analysis
2.3.1 pH
analysis
Sediment
pH was measured anaerobically using a pH meter with a 1:2 dilution of sediment
and 0.01 M CaCl2 solution. Briefly, 5 grams of wet sediment was
diluted with 10 ml of 0.01 CaCl2. The solution was stirred
intermittently for 30 minutes, then stood for 1 hour to settle. The pH of
supernatant solution was recoded on a ThermoFisher Orion 3.
2.3.2 Bioavailable Metal analysis
Bioavailable metals were
extracted with a 1.0 M HCl digest (Yu
et al., 2021). Briefly, 1 gram of ground air dried
sediment was digested with 20 ml of 1.0 M HCl over 4 hours. The Northern
Analytical Laboratory (NALs, UNBC) then measured the concentration of Al, As,
B, Ba, Ca, Cd, Co, Cr, Cu, Fe, K, Mg, Mn, Mo, Na, Ni, O, Ob, S, Sb, Se, Sn, U,
V, Zn using ICP-OES.
2.3.3 Carbon and Sulfur measurements
Total, organic and
inorganic carbon aswell as total sulfur was measured
at Natural Resources Canada, CanmetMINING using an
ELTRA Elementrac CS-d. Briefly, ca. 150-200
milligrams of air-dried sediment was burnt in a Resistance furnace measuring CO2
and SO2 gas produced which is then calculated into % total carbon
and % total sulfur. Another sediment sample was burnt at ca. 400-450 degrees C
for 12 hours in a muffle furnace, removing organic carbon. This sample is then
burnt in a resistance furnace to calculate % carbon in burnt sediment, or
inorganic carbon. Inorganic carbon in unburnt sediment is determined by Equation 1, where
%Rb is percent carbon in burnt samples, mb is mass of
burnt sample, and mo is mass of unburnt
sample. Organic carbon is then determined by Equation
2.
Equation 1![]()
Equation 2![]()
2.4
Metabarcoding analysis
DNA extractions were
performed using a Qiagen Soil DNeasy PowerSoil Pro
Kits (Cat. 47014) and then purified using Promegas ProNex®
Size-Selective Purification Magnetic beads (Cat. NG2001). Extractions were sent
to the integrated microbiome resource, Dalhousie University, Halifax, Nova
Scotia, Canada, where library preparation and long read sequencing was be performed
using PacBios vega. The full length bacterial 16S
sequence were amplified with 27F (AGRGTTYGATYMTGGCTCAG) and 1492R
(RGYTACCTTGTTACGACTT) (Buetas
et al., 2024; Paliy et al., 2009; Weisburg et al., 1991) and the full
length archaeal 16S sequence were
amplified with Arch21Ftrim (TCCGGTTGATCCYGCCGG) and A1401R (CRGTGWGTRCAAGGRGCA)
(Comeau
et al., 2011; Reysenbach et al., 2000).
The DADA2 pipeline was be
used to process raw reads (Callahan
et al., 2016) and a compositional data approach
were be used for the relevant statistics (Gloor
et al., 2017): Alpha diversity (Wereis
and Martin, 2018), beta diversity (Martino
et al., 2022), differential abundance (Nearing
et al., 2022), and network analysis (Matchado
et al., 2021).
2.6
qPCR
Bacterial and archaeal copy numbers
of the 16S gene and methanogen and methanotroph copy numbers of the McrA gene were quantified on a BioRad CFX Opus 384 (Chen et al., 2017; Lever et al.,
2015).
Reaction volumes of 10 µl consisted of 1 µl of 1/10 diluted template, 0.5 µM of
each primer, see Table 1., molecular-grade water and 1x of SSoAdvanced
Universal inhibitor Tolerant SYBR® Green Supermix (Bio-Rad, USA-CA) (Bott et al., 2023). Thermocycling conditions consisted
of an initial denaturation at 98°C for 120s, followed by 40 cycles of a
denaturation of 98°C for 10s, annealing at each primer sets annealing
temperature (Table 1) for 15s, and then extension at 72°C
for 30s. After the final extension step a melt curve analysis was performed
between 65 and 95°C at 0.5°C increments for 0.05s each to check for primer
specificity. gBlocks (IDT, CA) of 16S and McrA genes were produced as standards for each assay
based on if there were recommendations on which taxa to use in the original
paper (All McrA Assays), otherwise model
organisms were used (Methanococcus maripaludis, 16S total archaea assay; Escherichia
coli, 16S total bacteria assay) (Table 2). A standard series of gene covered
gene concentrations of 101 to 109 was performed for each
assay, however the linear range and efficiency of each assay differed slightly
(Table 3). The NTC, and its Cq value are remarked in Table 4. Each sample
was measured in triplicate or duplicate technical replicates if a single
technical replicate had an abnormal amplification curve.
Each Assays optimal annealing
temperature was determined by gradient qPCR, the possibility of multiple
products was measured by melt curve analysis and gel electrophoresis.
Thermocycling conditions consisted of an initial denaturation at 98°C for 120s,
followed by 40 cycles of a denaturation of 98°C for 10s, annealing varied
between 55 and 65°C for 15s, and then extension at 72°C for 30s. After the
final extension step a melt curve analysis was performed between 65 and 95°C at
0.5°C increments for 0.05s each to check for primer specificity. Reaction
conditions were the same as the assays above.
Table 1. 16S and McrA gene
primers used for qPCR examinations of bacterial, archaeal and methanogen
abundances
|
Region |
Forward Primer |
Forward primer
sequence |
Reverse primer |
Reverse primer
sequence |
Annealing
temperature (°C) |
Citation |
|
16S Total
bacteria |
Bac908F_mod |
5′-AAC TCA AAKGAATTG ACG GG-3′ |
Bac1075R |
5′CAC GAG CTG ACG ACA RCC-3′ |
60 |
(Chen et al.,
2017; Lever et al., 2015) |
|
16S Total
Archaea |
Arch915F_mod |
5′-AAT TGG CGG GGG AGC AC-3′ |
Arch1059R |
5′-GCC ATG CAC CWC CTC T-3′ |
NA |
(Chen et al.,
2017; Lever et al., 2015) |
|
McrA ANME-1 |
Type a-b_F |
5′-TGGTTCGG
AACGTACATGTC-3′ |
Type a-b_R |
5′-TCTYYT
CCAGRAT GTCCATG-3′ |
NA |
(Nunoura et al., 2006; Shi et al., 2020) |
|
McrA ANME 2a,b,c |
Type c-d_F |
5′-GCTCTAC GACCAG AT MTGG CTTGG-3′ |
Type c-d_R |
5′-CCGTAGTA CGTGAAGTCAT CCAGCA-3′ |
NA |
(Nunoura et al., 2006; Shi et al., 2020) |
|
McrA ANME-2d |
159F |
5′-AAAGTGCGG
AGCAGCAATCACC-3 |
345R |
5′-TCGTCCCATT
CCTGCTGCATTGC-3′ |
NA |
(Shi et al.,
2020; Vaksmaa et al., 2017) |
|
McrA ANME-3 |
Type e |
5′-CHCTGGAA
GATCACTTCGGTGGTTC-3′ |
Type e |
5′-RTATCCGAAG
AARCCSAGT CKRCC-3′ |
NA |
(Nunoura et al., 2006; Shi et al., 2020) |
|
McrA Total Methanogens and
ANME-2d |
mlas F |
5′- GGT
GTM GGD TTCACM CAR TA-3 |
mcrA-rev |
5′-CGTTCATB
GCGTAGTTVGGRTAGT-3 |
NA |
(Meier et al.,
2024; Steinberg and Regan, 2008) |
Table 2. The
taxa that the standards are based on and the associated qPCR assay. Citations
are provided if the taxa has been explicitly used
before as standard for the qPCR assay
|
qPCR Assay |
Reference
taxa |
ncbi accession number |
Citation (if
available) |
|
16S Total
Archaea |
Methanococcus maripaludis |
AF005049 |
NA |
|
16S Total
Bacteria |
Escherichia coli |
MN900682 |
NA |
|
McrA ANME-1 |
Uncultured
archaeon clone |
BX649197 |
(Nunoura et al.,
2006) |
|
McrA ANME-2a-c |
Uncultured
archaeon clone |
AY324368 |
(Nunoura et al.,
2006) |
|
McrA ANME-2d |
Candidatus Methanoperedens sp. |
KX290067 |
(Vaksmaa et al.,
2017) |
|
McrA ANME-3 |
Uncultured
archaeon clone |
AY324364 |
(Nunoura et al.,
2006) |
|
McrA Methanogens and ANME-2d |
Methanocorpusculum parvum |
NZ_LMVO01000029 |
(Meier et al.,
2024) |
Table 3. qPCR
Assay standard curve calculations
|
qPCR Assay |
Linear Range |
Efficiency (%) |
R2 |
Calibration curve slope |
Calibration curve y intercept |
|
16S Total
Archaea |
|
|
|
|
|
|
16S Total
Bacteria |
102-108 |
99.1 |
0.998 |
-3.344 |
33.442 |
|
McrA ANME-1 |
|
|
|
|
|
|
McrA ANME-2a-c |
|
|
|
|
|
|
McrA ANME-2d |
|
|
|
|
|
|
McrA ANME-3 |
|
|
|
|
|
|
McrA Methanogens and ANME-2d |
|
|
|
|
|
Table 4. Results
of the NTC in each qPCR assay
|
qPCR Assay |
NTC Cq |
Comment |
|
16S Total
Archaea |
|
|
|
16S Total
Bacteria |
31.72 |
The standard curve suggests this is a concentration
of 3.89 copies per reaction which is almost the theoretical limit to qPCR
limit of detection (3) (Bustin et al., 2009) |
|
McrA ANME-1 |
|
|
|
McrA ANME-2a-c |
|
|
|
McrA ANME-2d |
|
|
|
McrA ANME-3 |
|
|
|
McrA Methanogens and ANME-2d |
|
|
2.7 Incubations
The determination of
methanogenesis and methanotrophy rates can be measured via bag incubations of
the sediment using 13C-labeled Methane and the isotope dilution
model (Xiao
et al., 2018, 2017). Briefly, sediment was incubated at
environmentally relevant temperatures (ca. 4°C) for 1 month to allow for the
stabilization of microbial community and conditions. Sample were subsampled and
methane concentration and molar ratio were determined. Then 13C-labeled
Methane was to be added to the incubations for a 2% increase in total methane
and 13C concentration. Then a subsample would be removed for
isotopic and concentration analysis via GC-C-IRMS and GC-FID respectively.
Subsamples wouldve been tested 4 times for a total experiment length of 4
months. Methanogenesis and methanotrophy rates were to be calculated using the
following equations derived from Blackburn (1979).
This model assumes that methane production, p, and
consumption, r, are constant throughout experiment (Blackburn, 1979). The change in
methane concentration, C, can be described based on Equation 3 and Equation 4.
Equation 3. ![]()
Equation 4. ![]()
Assuming that methanotrophy produces methane at a
constant mole fraction (Rb) between 13C
and 12C based on the natural conditions, and methanotrophy consumes
methane at the current 13C and 12C ratio (R) the change
in this ratio can be described by Equation 5 and Equation 6 respectively. This model assumes enzyme
fractionalization is negligible. Mole fraction is described by Equation 7.
Equation 5. ![]()
Equation 6. ![]()
Equation 7. ![]()
Combining Equation 4 and Equation 7 creates Equation 8, and combining Equation 4 and Equation 8 creates Equation 9, initial conditions are represented by C0, R0.
The production and consumption rates are assumed to be inequal for Equation 9.
Equation 8. ![]()
Equation 9. ![]()
By plotting Equation 4 the slope p-r can be determined, and
by plotting Equation 9 the slop -p/p-r can be determined.
By combining these slopes methanogenesis (p) and methanotrophy (r) can be
calculated.
2.8 Methane flux and rate modeling introduction
There are three primary
methods to model methane flux and rates from and within lake sediments (DAmbrosio and Harrison, 2022). Sediment
incubations, like that presented in section 2.7, water column models, which
measure the methane profile in the water column, and sediment models (DAmbrosio and Harrison, 2022). Sediment models
allow the determination of methane flux from sediments into overlying waters
and net methane cycling rates based on methane concentrations within the
sediments, measured in section 2.2.3 (DAmbrosio and Harrison, 2022). These models are
limited by the often high error associated with measuring near sediment-surface
methane concentrations, due sediment disturbance caused by gravity coring (DAmbrosio and Harrison, 2022). These models
also exclude some sediment surface processes, e.g. ebullition, and are unable
to estimate sediment disturbance artifacts (DAmbrosio and Harrison, 2022). Since these
models are based on the current concentration of methane within sediments, they
have a spatial resolution dependent of the sample area and a temporal
resolution that can be projected as an average across months (DAmbrosio and Harrison, 2022). However, care
must be taken to over extrapolate these models as methane cycling rates, and
thus methane concentrations, can fluctuate seasonally especially in thermally
stratified lakes (DAmbrosio and Harrison, 2022; Kang et al., 2024).
Briefly, these are diffusion-reaction models based on
Fick first (Equation 3) and second law of diffusion with an
added term for net methane cycling (Equation 4) (DAmbrosio and Harrison, 2022).
Equation 3![]()
Equation 4![]()
Where J is flux, dCsed/dt is the methane concentration gradient
across time, t, dCsed/dz
is the methane concentration gradient across sediment depth, z, ϕ is
porosity, Ds is the sediment diffusivity of methane in porewater,
and R represents the net methane cycling rate.
2.8.1 Methane flux and modeling methods
The REC (v3.1) and PROFILE (v1.0) models were both run,
the parameters for the models are presented below (Berg
et al., 1998; Lettmann et al., 2012). Average methane concentration
measured in section 2.2.3 was assumed to be the steady state methane
concentration. While sedimentation data exists (see Gilbert and Desloges (2012))
this is from pre-disruption Quesnel lake and sites
with limited applicability to this works sampling regime. Thus, sedimentation
rates are excluded from modeling and assumed to be 0. Bioirrigation and
bioturbation are often included in modeling calculations; however, there was no
apparent burrows or animals within the sediments collected so these can be
assumed to be 0 (Berg
et al., 1998). A porosity of 0.9 was assumed based
on DAmbrosio and Harrison (2022). The depth dependent pore water diffusion
coefficient was calculated based on the relationship D = D0/(1+c(1- ϕ)) whereby D0
is the diffusion coefficient of methane in pure water (D0 = 0.66*10-5
cm2s-1) based on Lettmann et
al. (2012). Specifically for the REC model, the smoothing parameter was chosen
to be 100 based on Lettmann et al. (2012).
Specifically for the PROFILE model, the number of unique zones is determined by
the model itself (Berg
et al., 1998).
2.9 Statistical analysis
Each geochemical test was
tested for normality, and unimodality with a Shapiro-Wilks and Hartigans dip test respectively. All datasets were not
normally distributed and displayed a log-normal distribution. Samples were
grouped by depth and a Kruskal-Wallis rank sum test
was used to determine significance. If significance was detected the
Conover-Iman test was used as a post-hoc test.
3 Additional Results/Discussion
3.1 pH
pH within the tailings material on average is significantly higher by ca. 0.5 pH units than that within the natural sediments. Tailings deposition changes the pH of underlying natural sediments, such that there is only a nonsignificant difference in pH of the natural sediments between the disturbed and reference site at ca. 6 cm under the tailings material.
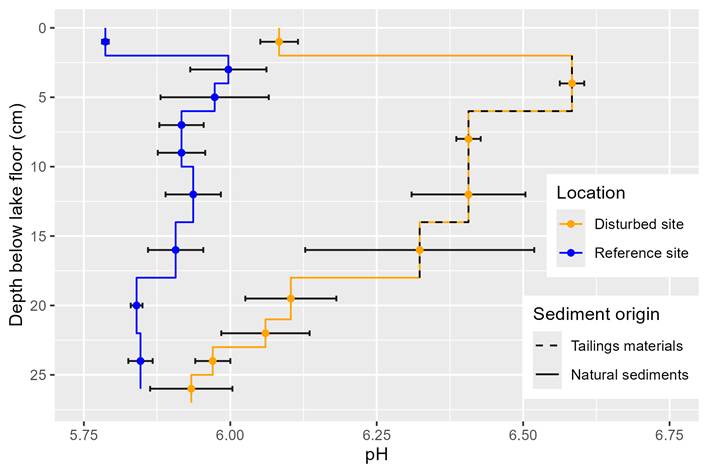
Figure 3. pH at different homogenized segments of depths in
disturbed and reference sites at Quesnel Lake. Segments are represented by
vertical lines between vertices and the tailings material is differentiated
from the natural sediments by a dashed line within the disturbed site.
3.2
Methane modeling
Both models agreed that there is net methane loading into
Quesnel Lake from the reference site; whereas, there
is net methane loading into the disturbed site sediments from Quesnel Lake (Table 5).
Table 5. Calculated methane flux at the sediment water interface in
both the disturbed and reference sites within Quesnel Lake based on the PROFILE
and REC models. A negative flux is net methane flux out of the sediment into
the overlying water, a positive flux is net methane flux into the sediment from
the overlying water.
|
Model |
Reference
site methane flux (µmol/cm2s) |
Disturbed
site methane flux (µmol/cm2s) |
|
PROFILE |
-2.570×10⁻⁴ |
1.074×10⁻⁵ |
|
REC |
-8.4385×10⁻⁵ |
5.7962×10⁻⁶ |
3.3 Incubations
After one month of stabilization there was no methane measured
within the incubations and the incubation experiment was postponed
indefinitely. With the added context of the methane modeling suggesting that
there is net methane consumption throughout most of the disturbed core and only
areas of net methane production within the reference core the lack of methane
generation is explained. An initial spike would then be required for future measurements.
4 References
4.1 Poster citations
DAmbrosio, S.L., Harrison, J.A., 2022. Measuring CH4 Fluxes From Lake and Reservoir Sediments: Methodologies and Needs. Front. Environ. Sci. 10, 850070. https://doi.org/10.3389/fenvs.2022.850070
Owens, P.N., Petticrew, E.L., Albers, S.J., French, T.D., Granger, B., Laval, B., Lindgren, J., Sussbauer, R., Vagle, S., 2023. Annual pulses of copper-enriched sediment in a North American river downstream of a large lake following the catastrophic failure of a mine tailings storage facility. Science of The Total Environment 856, 158927.
Petticrew, E.L., Albers, S.J., Baldwin, S.A., Carmack, E.C., Déry, S.J., Gantner, N., Graves, K.E., Laval, B., Morrison, J., Owens, P.N., Selbie, D.T., Vagle, S., 2015. The impact of a catastrophic mine tailings impoundment spill into one of North Americas largest fjord lakes: Quesnel Lake, British Columbia, Canada: Aquatic impacts of a mine tailings spill. Geophys. Res. Lett. 42, 33473355. https://doi.org/10.1002/2015GL063345
4.2 Supplementary materials citations
Anderson, J., Caron, F., Beckett, P., Spiers, G.A., Lévesque, N., Charbonneau, G.M., Halvorson, B., Dufour, H., Lock, A., 2022. Distribution of metals and radionuclides in the lichens Cladonia rangiferina and C. mitis from the past uranium mining region of Elliot Lake, Ontario, Canada. Heliyon 8, e11863. https://doi.org/10.1016/j.heliyon.2022.e11863
Baker, E., Thygesen, K., 2017. Mines tailings storage: Safety is no accident. UN Environment, GRID-Arendal, Nairobi, Kenya.
Berg, P., Risgaard‐Petersen, N., Rysgaard, S., 1998. Interpretation of measured concentration profiles in sediment pore water. Limnology & Oceanography 43, 15001510. https://doi.org/10.4319/lo.1998.43.7.1500
Blackburn, T.H., 1979. Method for Measuring Rates of NH 4 + Turnover in Anoxic Marine Sediments, Using a 15 N-NH 4 + Dilution Technique. Appl Environ Microbiol 37, 760765. https://doi.org/10.1128/aem.37.4.760-765.1979
Bott, T., Shaw, G., Gregory, S., 2023. A simple method for testing and controlling inhibition in soil and sediment samples for qPCR. Journal of Microbiological Methods 212, 106795. https://doi.org/10.1016/j.mimet.2023.106795
Buetas, E., Jordán-López, M., López-Roldán, A., DAuria, G., Martínez-Priego, L., De Marco, G., Carda-Diéguez, M., Mira, A., 2024. Full-length 16S rRNA gene sequencing by PacBio improves taxonomic resolution in human microbiome samples. BMC Genomics 25, 310. https://doi.org/10.1186/s12864-024-10213-5
Bustin, S.A., Benes, V., Garson, J.A., Hellemans, J., Huggett, J., Kubista, M., Mueller, R., Nolan, T., Pfaffl, M.W., Shipley, G.L., Vandesompele, J., Wittwer, C.T., 2009. The MIQE Guidelines: Minimum Information for Publication of Quantitative Real-Time PCR Experiments. Clinical Chemistry 55, 611622. https://doi.org/10.1373/clinchem.2008.112797
Byrne, P., Hudson-Edwards, K.A., Bird, G., Macklin, M.G., Brewer, P.A., Williams, R.D., Jamieson, H.E., 2018. Water quality impacts and river system recovery following the 2014 Mount Polley mine tailings dam spill, British Columbia, Canada. Applied Geochemistry 91, 6474. https://doi.org/10.1016/j.apgeochem.2018.01.012
Callahan, B.J., McMurdie, P.J., Rosen, M.J., Han, A.W., Johnson, A.J.A., Holmes, S.P., 2016. DADA2: High-resolution sample inference from Illumina amplicon data. Nat Methods 13, 581583. https://doi.org/10.1038/nmeth.3869
Chadwick, G.L., Skennerton, C.T., Laso-Pérez, R., Leu, A.O., Speth, D.R., Yu, H., Morgan-Lang, C., Hatzenpichler, R., Goudeau, D., Malmstrom, R., Brazelton, W.J., Woyke, T., Hallam, S.J., Tyson, G.W., Wegener, G., Boetius, A., Orphan, V.J., 2022. Comparative genomics reveals electron transfer and syntrophic mechanisms differentiating methanotrophic and methanogenic archaea. PLoS Biol 20, e3001508. https://doi.org/10.1371/journal.pbio.3001508
Chen, X., Andersen, T.J., Morono, Y., Inagaki, F., Jørgensen, B.B., Lever, M.A., 2017. Bioturbation as a key driver behind the dominance of Bacteria over Archaea in near-surface sediment. Sci Rep 7, 2400. https://doi.org/10.1038/s41598-017-02295-x
Clulow, V., 2018. Environmental Recovery at the Elliot Lake Historical Mines Sites.
Comeau, A.M., Li, W.K.W., Tremblay, J.-É., Carmack, E.C., Lovejoy, C., 2011. Arctic Ocean Microbial Community Structure before and after the 2007 Record Sea Ice Minimum. PLoS ONE 6, e27492. https://doi.org/10.1371/journal.pone.0027492
DAmbrosio, S.L., Harrison, J.A., 2022. Measuring CH4 Fluxes From Lake and Reservoir Sediments: Methodologies and Needs. Front. Environ. Sci. 10, 850070. https://doi.org/10.3389/fenvs.2022.850070
Gloor, G.B., Macklaim, J.M., Pawlowsky-Glahn, V., Egozcue, J.J., 2017. Microbiome Datasets Are Compositional: And This Is Not Optional. Front. Microbiol. 8, 2224. https://doi.org/10.3389/fmicb.2017.02224
Granger, B., Laval, B., Vagle, S., Petticrew, E.L., Owens, P.N., Baldwin, S.A., 2022. Initial Distribution and Interannual Decrease of Suspended Sediment in a Two‐Basin Lake Following a Massive Mine Tailings Spill: Quesnel Lake, BC, Canada. Water Resources Research 58. https://doi.org/10.1029/2021WR030574
Hatam, I., Petticrew, E.L., French, T.D., Owens, P.N., Laval, B., Baldwin, S.A., 2019. The bacterial community of Quesnel Lake sediments impacted by a catastrophic mine tailings spill differ in composition from those at undisturbed locations two years post-spill. Sci Rep 9, 2705. https://doi.org/10.1038/s41598-019-38909-9
Jackson, R.B., Abernethy, S., Canadell, J.G., Cargnello, M., Davis, S.J., Féron, S., Fuss, S., Heyer, A.J., Hong, C., Jones, C.D., Damon Matthews, H., OConnor, F.M., Pisciotta, M., Rhoda, H.M., de Richter, R., Solomon, E.I., Wilcox, J.L., Zickfeld, K., 2021. Atmospheric methane removal: a research agenda. Philos Trans A Math Phys Eng Sci 379, 20200454. https://doi.org/10.1098/rsta.2020.0454
Kang, M., Liu, L., Grossart, H.-P., 2024. Spatio-temporal variations of methane fluxes in sediments of a deep stratified temperate lake. iScience 27, 109520. https://doi.org/10.1016/j.isci.2024.109520
Lettmann, K.A., Riedinger, N., Ramlau, R., Knab, N., Böttcher, M.E., Khalili, A., Wolff, J.-O., Jørgensen, B.B., 2012. Estimation of biogeochemical rates from concentration profiles: A novel inverse method. Estuarine, Coastal and Shelf Science 100, 2637. https://doi.org/10.1016/j.ecss.2011.01.012
Lever, M.A., Torti, A., Eickenbusch, P., Michaud, A.B., Šantl-Temkiv, T., Jørgensen, B.B., 2015. A modular method for the extraction of DNA and RNA, and the separation of DNA pools from diverse environmental sample types. Front. Microbiol. 6. https://doi.org/10.3389/fmicb.2015.00476
Mandryk, R.R., Capelle, D.W., Manning, C.C.M., Tortell, P., McCulloch, R.D., Papakyriakou, T., 2021. First estimation of the diffusive methane flux and concentrations from Lake Winnipeg, a large, shallow and eutrophic lake. Journal of Great Lakes Research 47, 741750. https://doi.org/10.1016/j.jglr.2021.03.011
Mao, S.-H., Zhang, H.-H., Zhuang, G.-C., Li, X.-J., Liu, Q., Zhou, Z., Wang, W.-L., Li, C.-Y., Lu, K.-Y., Liu, X.-T., Montgomery, A., Joye, S.B., Zhang, Y.-Z., Yang, G.-P., 2022. Aerobic oxidation of methane significantly reduces global diffusive methane emissions from shallow marine waters. Nat Commun 13, 7309. https://doi.org/10.1038/s41467-022-35082-y
Martino, C., McDonald, D., Cantrell, K., Dilmore, A.H., Vázquez-Baeza, Y., Shenhav, L., Shaffer, J.P., Rahman, G., Armstrong, G., Allaband, C., Song, S.J., Knight, R., 2022. Compositionally Aware Phylogenetic Beta-Diversity Measures Better Resolve Microbiomes Associated with Phenotype. mSystems 7, e00050-22. https://doi.org/10.1128/msystems.00050-22
Matchado, M.S., Lauber, M., Reitmeier, S., Kacprowski, T., Baumbach, J., Haller, D., List, M., 2021. Network analysis methods for studying microbial communities: A mini review. Computational and Structural Biotechnology Journal 19, 26872698. https://doi.org/10.1016/j.csbj.2021.05.001
Maus, V., Giljum, S., Gutschlhofer, J., Da Silva, D.M., Probst, M., Gass, S.L.B., Luckeneder, S., Lieber, M., McCallum, I., 2020. A global-scale data set of mining areas. Sci Data 7, 289. https://doi.org/10.1038/s41597-020-00624-w
Meier, D., Van Grinsven, S., Michel, A., Eickenbusch, P., Glombitza, C., Han, X., Fiskal, A., Bernasconi, S., Schubert, C.J., Lever, M.A., 2024. Hydrogenindependent CO2 reduction dominates methanogenesis in five temperate lakes that differ in trophic states. ISME Communications 4, ycae089. https://doi.org/10.1093/ismeco/ycae089
Nearing, J.T., Douglas, G.M., Hayes, M.G., MacDonald, J., Desai, D.K., Allward, N., Jones, C.M.A., Wright, R.J., Dhanani, A.S., Comeau, A.M., Langille, M.G.I., 2022. Microbiome differential abundance methods produce different results across 38 datasets. Nat Commun 13, 342. https://doi.org/10.1038/s41467-022-28034-z
Nunoura, T., Oida, H., Toki, T., Ashi, J., Takai, K., Horikoshi, K., 2006. Quantification of mcrA by quantitative fluorescent PCR in sediments from methane seep of the Nankai Trough: Quantification of mcrA by fluorescent PCR in methane seep. FEMS Microbiology Ecology 57, 149157. https://doi.org/10.1111/j.1574-6941.2006.00101.x
Owens, P.N., Petticrew, E.L., Albers, S.J., French, T.D., Granger, B., Laval, B., Lindgren, J., Sussbauer, R., Vagle, S., 2023. Annual pulses of copper-enriched sediment in a North American river downstream of a large lake following the catastrophic failure of a mine tailings storage facility. Science of The Total Environment 856, 158927. https://doi.org/10.1016/j.scitotenv.2022.158927
Paliy, O., Kenche, H., Abernathy, F., Michail, S., 2009. High-Throughput Quantitative Analysis of the Human Intestinal Microbiota with a Phylogenetic Microarray. Applied and Environmental Microbiology 75, 35723579. https://doi.org/10.1128/AEM.02764-08
Petticrew, E.L., Albers, S.J., Baldwin, S.A., Carmack, E.C., Déry, S.J., Gantner, N., Graves, K.E., Laval, B., Morrison, J., Owens, P.N., Selbie, D.T., Vagle, S., 2015. The impact of a catastrophic mine tailings impoundment spill into one of North Americas largest fjord lakes: Quesnel Lake, British Columbia, Canada: Aquatic impacts of a mine tailings spill. Geophys. Res. Lett. 42, 33473355. https://doi.org/10.1002/2015GL063345
Pyle, G.G., Plomp, R.D., Zink, L., Klemish, J.L., 2022. Invertebrate metal accumulation and toxicity from sediments affected by the Mount Polley mine disaster. Environ Sci Pollut Res Int 29, 7038070395. https://doi.org/10.1007/s11356-022-20677-1
Reysenbach, A.-L., Longnecker, K., Kirshtein, J., 2000. Novel Bacterial and Archaeal Lineages from an In Situ Growth Chamber Deployed at a Mid-Atlantic Ridge Hydrothermal Vent. Appl Environ Microbiol 66, 37983806.
Saunois, M., Stavert, A.R., Poulter, B., Bousquet, P., Canadell, J.G., Jackson, R.B., Raymond, P.A., Dlugokencky, E.J., Houweling, S., Patra, P.K., Ciais, P., Arora, V.K., Bastviken, D., Bergamaschi, P., Blake, D.R., Brailsford, G., Bruhwiler, L., Carlson, K.M., Carrol, M., Castaldi, S., Chandra, N., Crevoisier, C., Crill, P.M., Covey, K., Curry, C.L., Etiope, G., Frankenberg, C., Gedney, N., Hegglin, M.I., Höglund-Isaksson, L., Hugelius, G., Ishizawa, M., Ito, A., Janssens-Maenhout, G., Jensen, K.M., Joos, F., Kleinen, T., Krummel, P.B., Langenfelds, R.L., Laruelle, G.G., Liu, L., Machida, T., Maksyutov, S., McDonald, K.C., McNorton, J., Miller, P.A., Melton, J.R., Morino, I., Müller, J., Murguia-Flores, F., Naik, V., Niwa, Y., Noce, S., ODoherty, S., Parker, R.J., Peng, C., Peng, S., Peters, G.P., Prigent, C., Prinn, R., Ramonet, M., Regnier, P., Riley, W.J., Rosentreter, J.A., Segers, A., Simpson, I.J., Shi, H., Smith, S.J., Steele, L.P., Thornton, B.F., Tian, H., Tohjima, Y., Tubiello, F.N., Tsuruta, A., Viovy, N., Voulgarakis, A., Weber, T.S., van Weele, M., van der Werf, G.R., Weiss, R.F., Worthy, D., Wunch, D., Yin, Y., Yoshida, Y., Zhang, W., Zhang, Z., Zhao, Y., Zheng, B., Zhu, Qing, Zhu, Qiuan, Zhuang, Q., 2020. The Global Methane Budget 20002017. Earth System Science Data 12, 15611623. https://doi.org/10.5194/essd-12-1561-2020
Shi, L.-D., Guo, T., Lv, P.-L., Niu, Z.-F., Zhou, Y.-J., Tang, X.-J., Zheng, P., Zhu, L.-Z., Zhu, Y.-G., Kappler, A., Zhao, H.-P., 2020. Coupled anaerobic methane oxidation and reductive arsenic mobilization in wetland soils. Nat. Geosci. 13, 799805. https://doi.org/10.1038/s41561-020-00659-z
Steinberg, L.M., Regan, J.M., 2008. Phylogenetic Comparison of the Methanogenic Communities from an Acidic, Oligotrophic Fen and an Anaerobic Digester Treating Municipal Wastewater Sludge. Appl Environ Microbiol 74, 66636671. https://doi.org/10.1128/AEM.00553-08
Vaksmaa, A., Jetten, M.S.M., Ettwig, K.F., Lüke, C., 2017. McrA primers for the detection and quantification of the anaerobic archaeal methanotroph Candidatus Methanoperedens nitroreducens. Appl Microbiol Biotechnol 101, 16311641. https://doi.org/10.1007/s00253-016-8065-8
Van Grinsven, S., Meier, D.V., Michel, A., Han, X., Schubert, C.J., Lever, M.A., 2022. Redox Zone and Trophic State as Drivers of Methane-Oxidizing Bacterial Abundance and Community Structure in Lake Sediments. Front. Environ. Sci. 10, 857358. https://doi.org/10.3389/fenvs.2022.857358
Walton, R.E., Moorhouse, H.L., Roberts, L.R., Salgado, J., Ladd, C.J., Do, N.T., Panizzo, V.N., Van, P.D.T., Downes, N.K., Trinh, D.A., McGowan, S., Taylor, S., Henderson, A.C., 2023. Using lake sediments to assess the long-term impacts of anthropogenic activity in tropical river deltas. The Anthropocene Review 20530196231204334. https://doi.org/10.1177/20530196231204334
Weisburg, W.G., Barns, S.M., Pelletier, D.A., Lane, D.J., 1991. 16S ribosomal DNA amplification for phylogenetic study. J Bacteriol 173, 697703. https://doi.org/10.1128/jb.173.2.697-703.1991
Willis, A.D., Martin, B.D., 2018. DivNet: Estimating diversity in networked communities. https://doi.org/10.1101/305045
Xiao, K., Beulig, F., Røy, H., Jørgensen, B.B., Risgaard‐Petersen, N., 2018. Methylotrophic methanogenesis fuels cryptic methane cycling in marine surface sediment. Limnology & Oceanography 63, 15191527. https://doi.org/10.1002/lno.10788
Xiao, K.-Q., Beulig, F., Kjeldsen, K.U., Jørgensen, B.B., Risgaard-Petersen, N., 2017. Concurrent Methane Production and Oxidation in Surface Sediment from Aarhus Bay, Denmark. Front. Microbiol. 8, 1198. https://doi.org/10.3389/fmicb.2017.01198
Yu, Z., Liu, E., Lin, Q., Zhang, E., Yang, F., Wei, C., Shen, J., 2021. Comprehensive assessment of heavy metal pollution and ecological risk in lake sediment by combining total concentration and chemical partitioning. Environmental Pollution 269, 116212. https://doi.org/10.1016/j.envpol.2020.116212